

Website Design
A website can look finished, load fine on your own laptop, and still fail the only speed test Google actually grades. That test is Core Web Vitals, and it runs on data collected from real people visiting your site on real devices and real connections. This guide explains what the three metrics measure, what the passing numbers are in 2026, how to find out where your site currently stands, and what it realistically takes to fix a failing score.
What Are the Core Web Vitals?
Core Web Vitals are three metrics Google uses to score real user experience on a web page: Largest Contentful Paint, which measures loading speed, Interaction to Next Paint, which measures responsiveness, and Cumulative Layout Shift, which measures visual stability. A page passes when all three meet their thresholds for 75 percent of visits.
The important word in that definition is real. Core Web Vitals are not a simulation. Google collects the numbers from the Chrome User Experience Report, an anonymized dataset gathered from Chrome users who have opted in. That means your score reflects the phone your customer is holding in a parking lot on a weak signal, not the fiber connection in your office.
Google groups Core Web Vitals under its broader page experience signals. They sit alongside HTTPS and mobile usability as things the search engine can measure automatically at scale, which is exactly why they became ranking factors in the first place.
What Do LCP, INP, and CLS Actually Measure?
Each metric captures a different moment in the experience of loading and using a page. Once you understand what each one is watching for, the fixes stop feeling like guesswork.
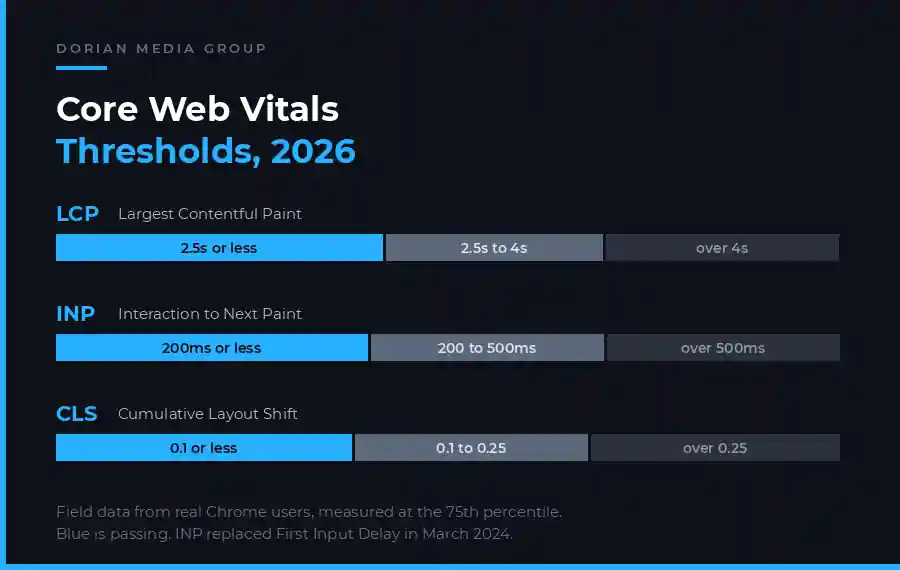
| 01 | Largest Contentful Paint, 2.5 seconds or less. LCP marks the moment the biggest visible element finishes rendering. On most business websites that element is the hero image, the header video, or a large block of headline text. It answers the visitor’s first question, which is whether anything is happening at all. |
| 02 | Interaction to Next Paint, 200 milliseconds or less. INP measures the delay between a visitor tapping something and the screen visibly responding. It replaced First Input Delay in March 2024 because the older metric only looked at the very first interaction, which flattered pages that felt sluggish for the rest of the visit. |
| 03 | Cumulative Layout Shift, 0.1 or less. CLS scores how much the page jumps around while it loads. It is the metric behind the familiar experience of reaching for a button, watching an ad slot load above it, and tapping the wrong thing entirely. Unlike the other two it has no unit, just a score. |
Every threshold is measured at the 75th percentile, which trips up more site owners than any other detail. Your site does not pass because the average visit is fast. It passes when three out of four visits are fast. One slow template, one heavy landing page, or one region with poor server coverage can drag the whole assessment down while your averages look healthy.
How Do You Check Your Own Core Web Vitals?
There are two kinds of measurement and confusing them is the single most common reason people think their site is fine when it is not. Lab data comes from a simulated load on a machine you control. Field data comes from actual visitors over the previous 28 days. Google ranks on field data.
The Core Web Vitals report inside Google Search Console is the authoritative view because it uses field data and groups your URLs into buckets of similar pages. If forty product pages share one failing template, the report shows you the template, not forty separate problems. Start there.
PageSpeed Insights is the second stop. It shows field data at the top when Google has enough traffic from your site to report it, and lab diagnostics below. Those lab diagnostics are where the actionable detail lives, because they name the specific script, image, or font that is holding you back. Treat the field numbers as your grade and the lab numbers as your to do list.
A newer site with low traffic often has no field data at all. That is not a failure, it just means Chrome has not collected enough samples. In that situation lab data is all you have, and it is still worth acting on, because the underlying causes are the same either way.
What Actually Causes a Failing Score?
Across the sites we audit, failures cluster into a short list of repeat offenders. The technical vocabulary varies, the causes rarely do.
Oversized hero images. A 3 megabyte photograph exported straight from a camera and dropped into a header is the most common LCP failure we find. Serving that same image as a properly sized WebP file routinely cuts it below 200 kilobytes with no visible quality loss.
Slow server response. If the server takes more than half a second to send the first byte, every metric downstream inherits that delay. Cheap shared hosting is frequently the culprit, which is why what you pay for website hosting shows up directly in your Core Web Vitals report.
Third party scripts. Chat widgets, heat maps, review carousels, and four separate analytics tags all compete for the same main thread. This is the usual source of a failing INP score, because every one of those scripts has to finish its work before the browser can respond to a tap.
Images and embeds without dimensions. When an image tag has no width and height, the browser cannot reserve space for it, so everything below jumps when it arrives. That is a CLS failure, and it is usually a one line fix per element.
Web fonts that swap late. A custom font loading after the page renders causes a flash of unstyled text and a layout shift as the letterforms change width. Preloading the font file and setting a sensible fallback removes both problems.
Page builder bloat. Drag and drop builders often load the entire framework on every page whether or not the page uses it. On a brochure site this can mean several hundred kilobytes of unused code delivered before the first paragraph appears.
Not sure which of these is costing you traffic?
We audit the field data, identify the template causing the failure, and rebuild the pages that matter most. See how we approach website design and development.
How Do You Pass the Core Web Vitals Assessment?
You pass by fixing the three metrics in the order that produces the most improvement for the least work. In practice that means image and server work first, layout stability second, and script reduction last, because the last one usually requires a business decision about which tools you are willing to remove.
| 01 | Fix the largest element first. Identify what your LCP element actually is, then compress it, serve it as WebP or AVIF, size it correctly for mobile, and preload it. Never lazy load the hero image, which is a mistake we see constantly, because lazy loading the very thing LCP measures makes the score worse. |
| 02 | Cut time to first byte. Add full page caching, put a content delivery network in front of the site, and move off oversubscribed shared hosting if the server is consistently slow. This single change often improves LCP for every page at once. |
| 03 | Reserve space for everything. Set explicit width and height attributes on images, iframes, and video embeds. Give ad slots and dynamically injected banners a fixed container. Load web fonts with a matched fallback so the swap does not resize your headlines. |
| 04 | Audit and defer your scripts. List every third party tag, decide which ones you would notice losing, delete the rest, and load what remains after the page becomes interactive. Breaking large JavaScript bundles into smaller pieces gives the browser room to respond between tasks, which is exactly what INP rewards. |
| 05 | Then wait, and watch the field data. Because the report uses a rolling 28 day window, a fix deployed today does not show fully in Search Console for about a month. Validate the change in lab data immediately, then confirm it in field data later. |
Do Core Web Vitals Actually Affect Rankings?
Yes, but as a tiebreaker rather than a primary factor. Google has been consistent on this point: relevance and content quality decide most of the ordering, and page experience separates pages that are otherwise closely matched. A fast page about the wrong topic will not outrank a slow page that answers the question properly.
The larger effect is commercial rather than algorithmic. Slow pages lose people before the page finishes loading, and those visitors never enter your funnel at all. In the accounts we manage, the sites that moved from failing to passing typically saw bounce rate improve by 8 to 15 percent on mobile within two months, and the ranking movement followed the engagement improvement rather than preceding it.
There is also a compounding relationship with the rest of your search work. Crawl efficiency improves when pages respond faster, and content investments pay back sooner on a site that holds attention. If you are already investing in SEO services for a small business, fixing performance protects that investment rather than competing with it.
What Does It Cost and How Long Does It Take?
For a typical small business site of 20 to 60 pages built on a mainstream content management system, the work divides into three tiers. Configuration work, meaning caching, a content delivery network, image compression, and adding dimensions to media, usually runs 8 to 16 hours and resolves most CLS and many LCP failures on its own.
Template level work, meaning reworking the header, removing unused framework code, and restructuring how scripts load, is where INP failures actually get solved. Budget 20 to 40 hours depending on how heavily the site depends on a page builder. Full rebuilds only make sense when the underlying theme is the problem, which we find in roughly one in four audits.
On timing, expect to see lab improvements the same day you deploy and field improvements confirmed in Search Console 28 to 35 days later. That lag is the reason performance work should start before a seasonal push, not during one. Ongoing website maintenance matters here too, because a site that passes in January can quietly fail by June after a few plugin updates and a new tracking tag.
Passing the vitals starts with finding what is dragging them down. Our diagnostic on website speed optimization ranks the five causes we find most on client sites and labels each fix DIY or hire it out.
Frequently Asked Questions
What are the three Core Web Vitals?
Largest Contentful Paint measures loading, Interaction to Next Paint measures responsiveness, and Cumulative Layout Shift measures visual stability. Google reports all three together and a page must meet every threshold to be counted as passing.
What is a good Core Web Vitals score in 2026?
A passing page loads its largest element in 2.5 seconds or less, responds to interactions within 200 milliseconds, and holds a layout shift score of 0.1 or less, for at least 75 percent of real visits over a rolling 28 day window.
Why is my PageSpeed Insights score different from Search Console?
PageSpeed Insights shows a lab score from a simulated load on a throttled device, while Search Console reports field data from real Chrome users over 28 days. Google ranks on field data, so treat Search Console as the score that counts.
Did INP replace First Input Delay?
Yes. Interaction to Next Paint became an official Core Web Vital in March 2024, replacing First Input Delay. The change matters because FID only measured the first interaction, while INP looks at responsiveness throughout the entire visit.
How long does it take to fix Core Web Vitals?
Configuration fixes take 8 to 16 hours of work and template level fixes take 20 to 40 hours. Because the report uses a 28 day rolling window, Search Console usually confirms the improvement about a month after the changes go live.
Do Core Web Vitals matter if my site has very little traffic?
They still matter, though Google may not have enough Chrome samples to report field data for a low traffic site. Use lab data from PageSpeed Insights instead, since the underlying causes and fixes are identical.
The Short Version
Core Web Vitals reward sites that respect the visitor’s time and their data plan. Open the Core Web Vitals report in Search Console, find the template driving the failures rather than chasing individual URLs, fix images and server response first, reserve space for anything that loads late, and be ruthless about third party scripts. Then give the field data a month to catch up before you judge the result.
Google publishes the full technical definitions on web.dev and documents how the metrics fit into ranking on its page experience guidance. Both are worth reading if you plan to brief a developer.
Want your site to pass without guessing at it?
Dorian Media Group builds and rebuilds business websites that load fast on real devices, not just on a developer’s machine. Start with our website design and development work, or get in touch to have your current site audited.
In this article

Written by
DORIAN MEDIA GROUP
Dorian Media Group is a creative AI agency and production company that unifies brand strategy, premium content, website design, and AI powered marketing into one cohesive system built to grow your business.



Social Media Channels